


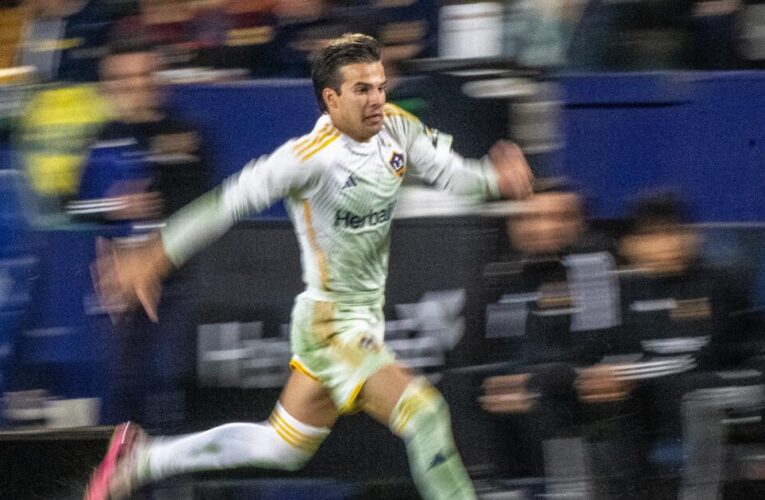
How will the Galaxy offset the loss of Riqui Puig in MLS Cup final?
In a team sport no player is irreplaceable. But for the Galaxy, Riqui Puig comes close. Puig, the playmaker and leader of one of the most potent attacks in franchise history, will miss Saturday’s MLS Cup final with the New York Red Bulls at Dignity Health Sports Park after tearing the anterior cruciate ligament in his left knee in last weekend’s Western Conference final with Seattle. He will undergo surgery soon and is expected to be out until next summer at least. And that leaves the Galaxy searching for a replacement for their most irreplaceable player. “We’re definitely going to miss Riqui,” midfielder Mark Delgado said Tuesday. “Special player. He just brings something completely different that nobody can really bring. “We just have to move forward. The game stops for no one and we just have to sort it out. And that’s Greg’s job.” Greg would be coach Greg Vanney, who was guarded in how he might alter his lineup in Puig’s absence Saturday. When Puig was unavailable during the regular season, Vanney used Marco Reus and Diego Fagúndez in his place. But Reus is